
For high-school cross country
Know the race.
Share it with everyone.
CATLIN Zero reads every result your team has on file, works out how your next race is likely to go, and tells you the handful of matchups that actually decide it. Then it keeps the order at the finish line — and hands the parents in the tent a link so they can watch it happen.
The model reasons.
The software scores.
The coach decides.
A language model reads the evidence and proposes who finishes where. A scoring engine works out the score, by the same rules an official would use — so the projection is an opinion, and every number attached to it is arithmetic.
Before the start
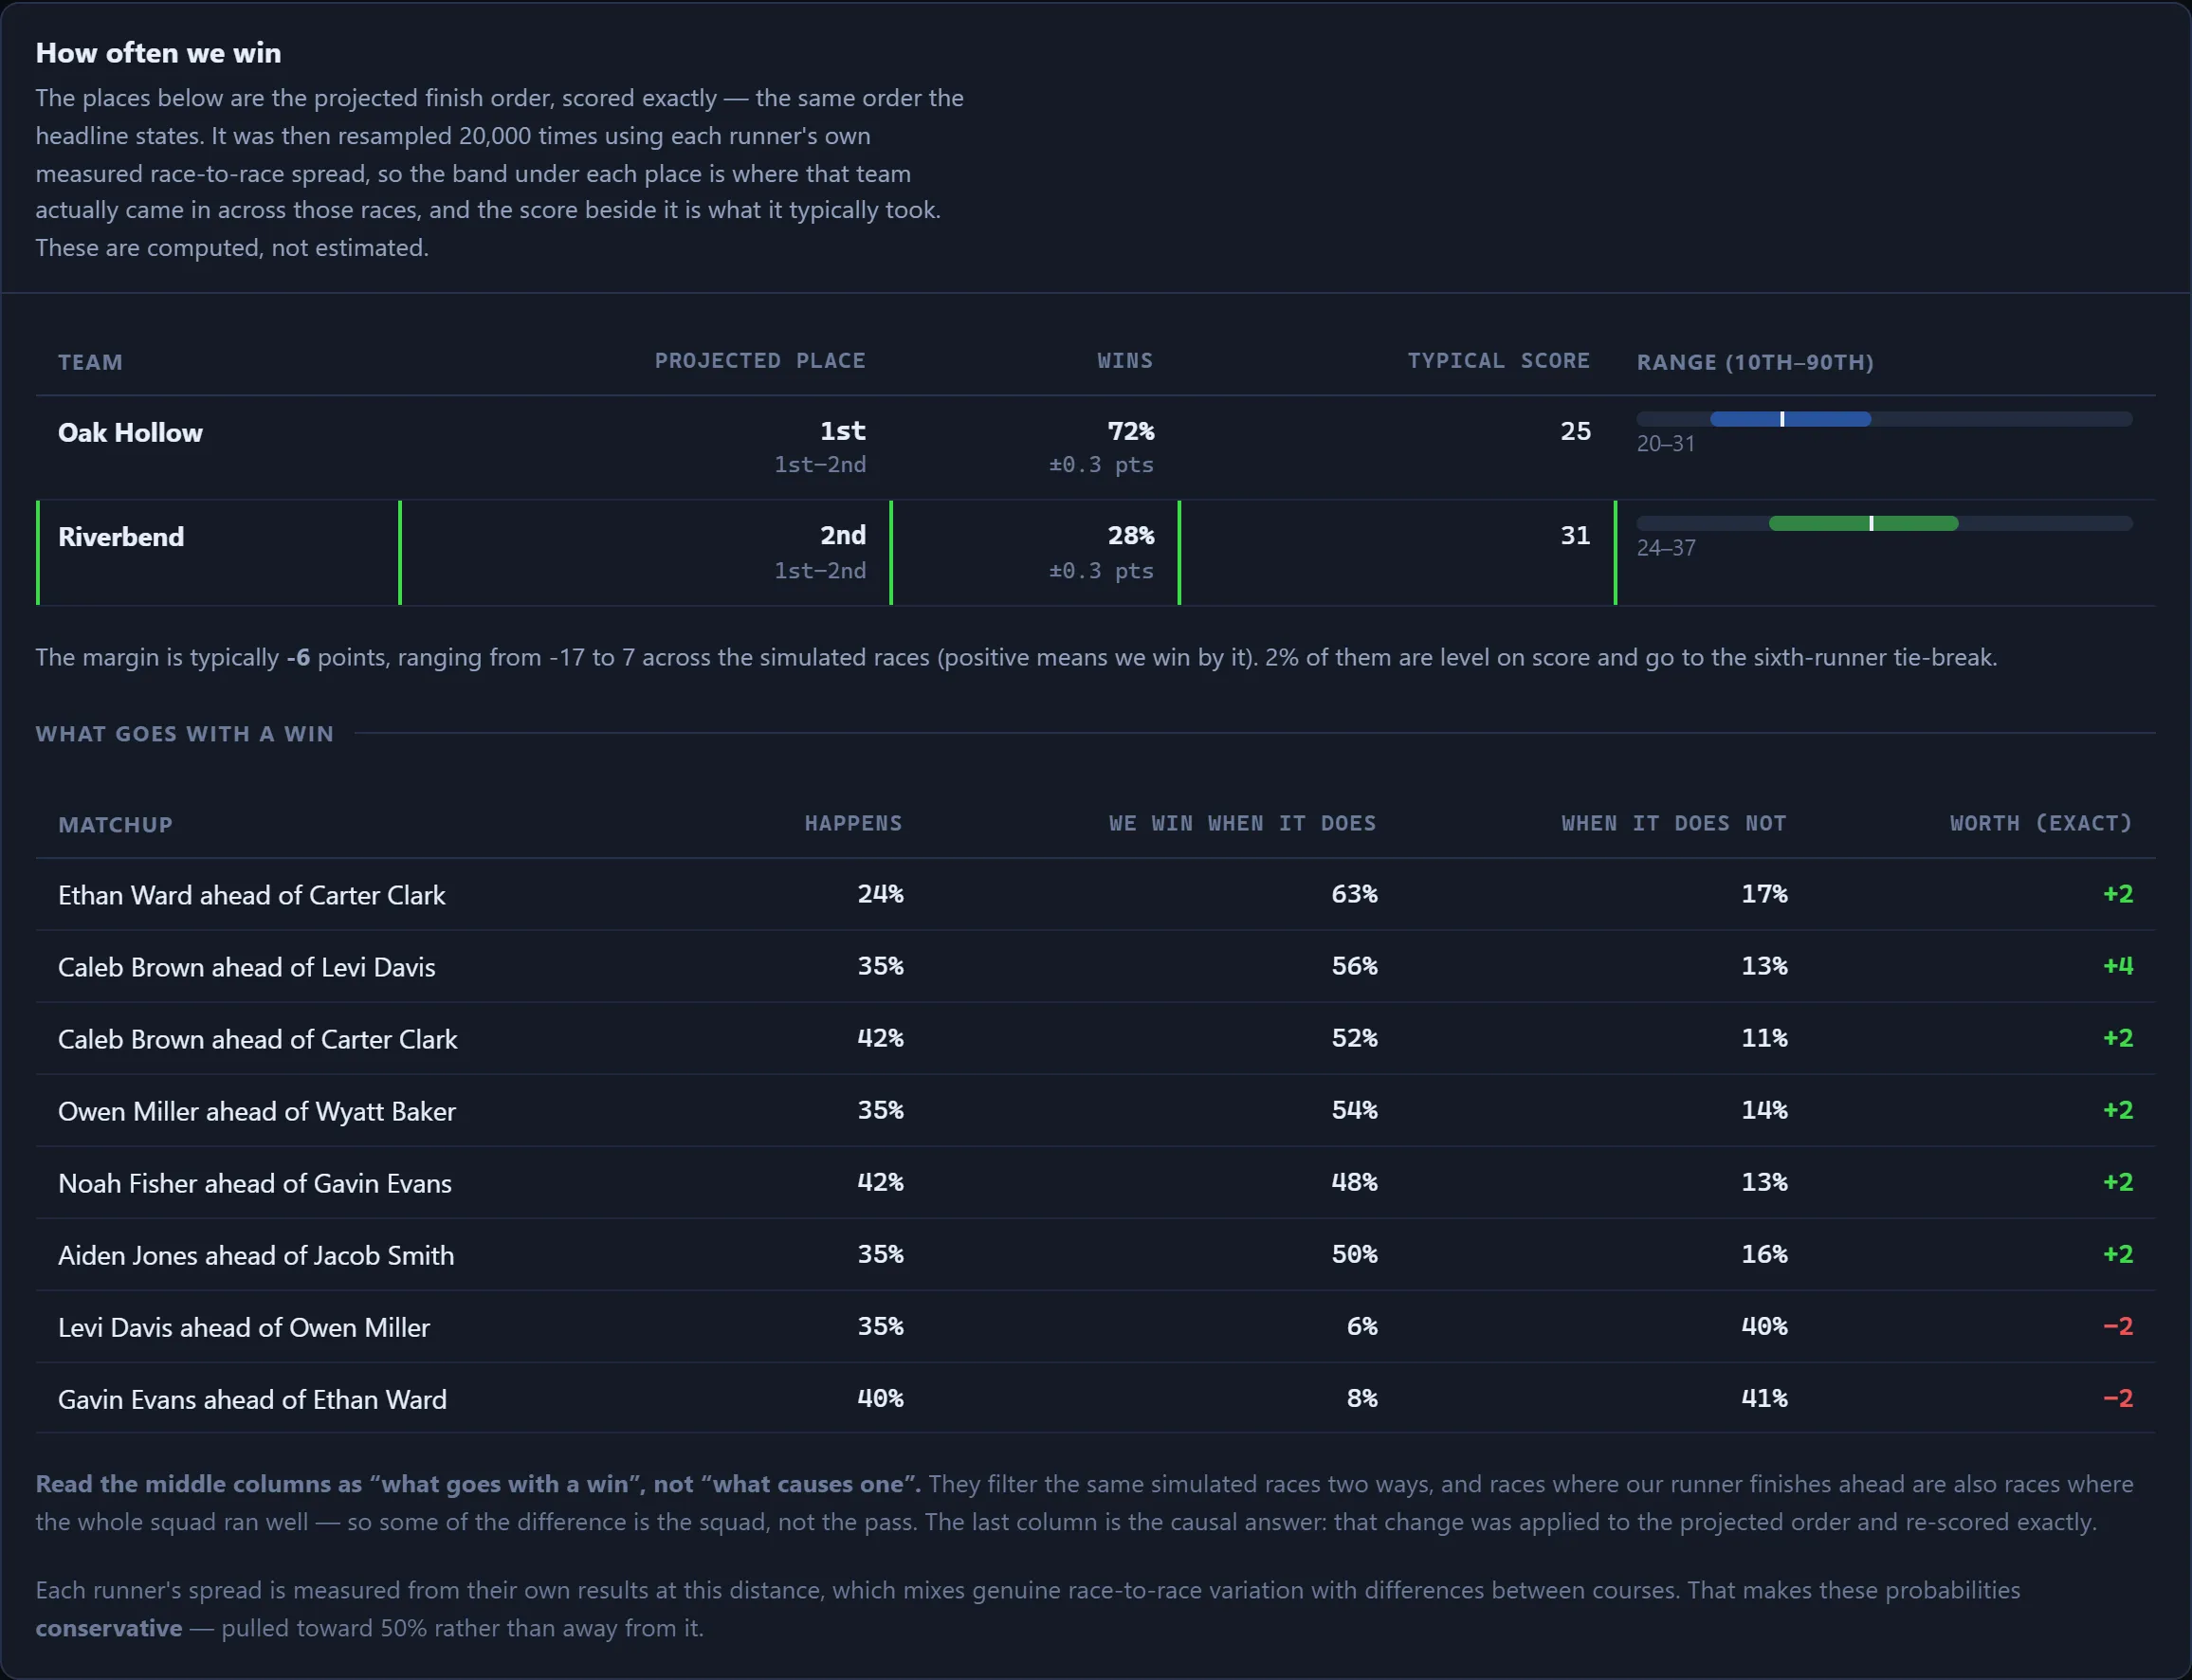
The three matchups that decide the meet
Paste results from MileSplit, Athletic.net, a spreadsheet or a timing PDF — or drop in a photo of the printout taped to the fence. Add what the data cannot show: who tempo-ran on Tuesday, who rolled an ankle, who is being rested.
You get...
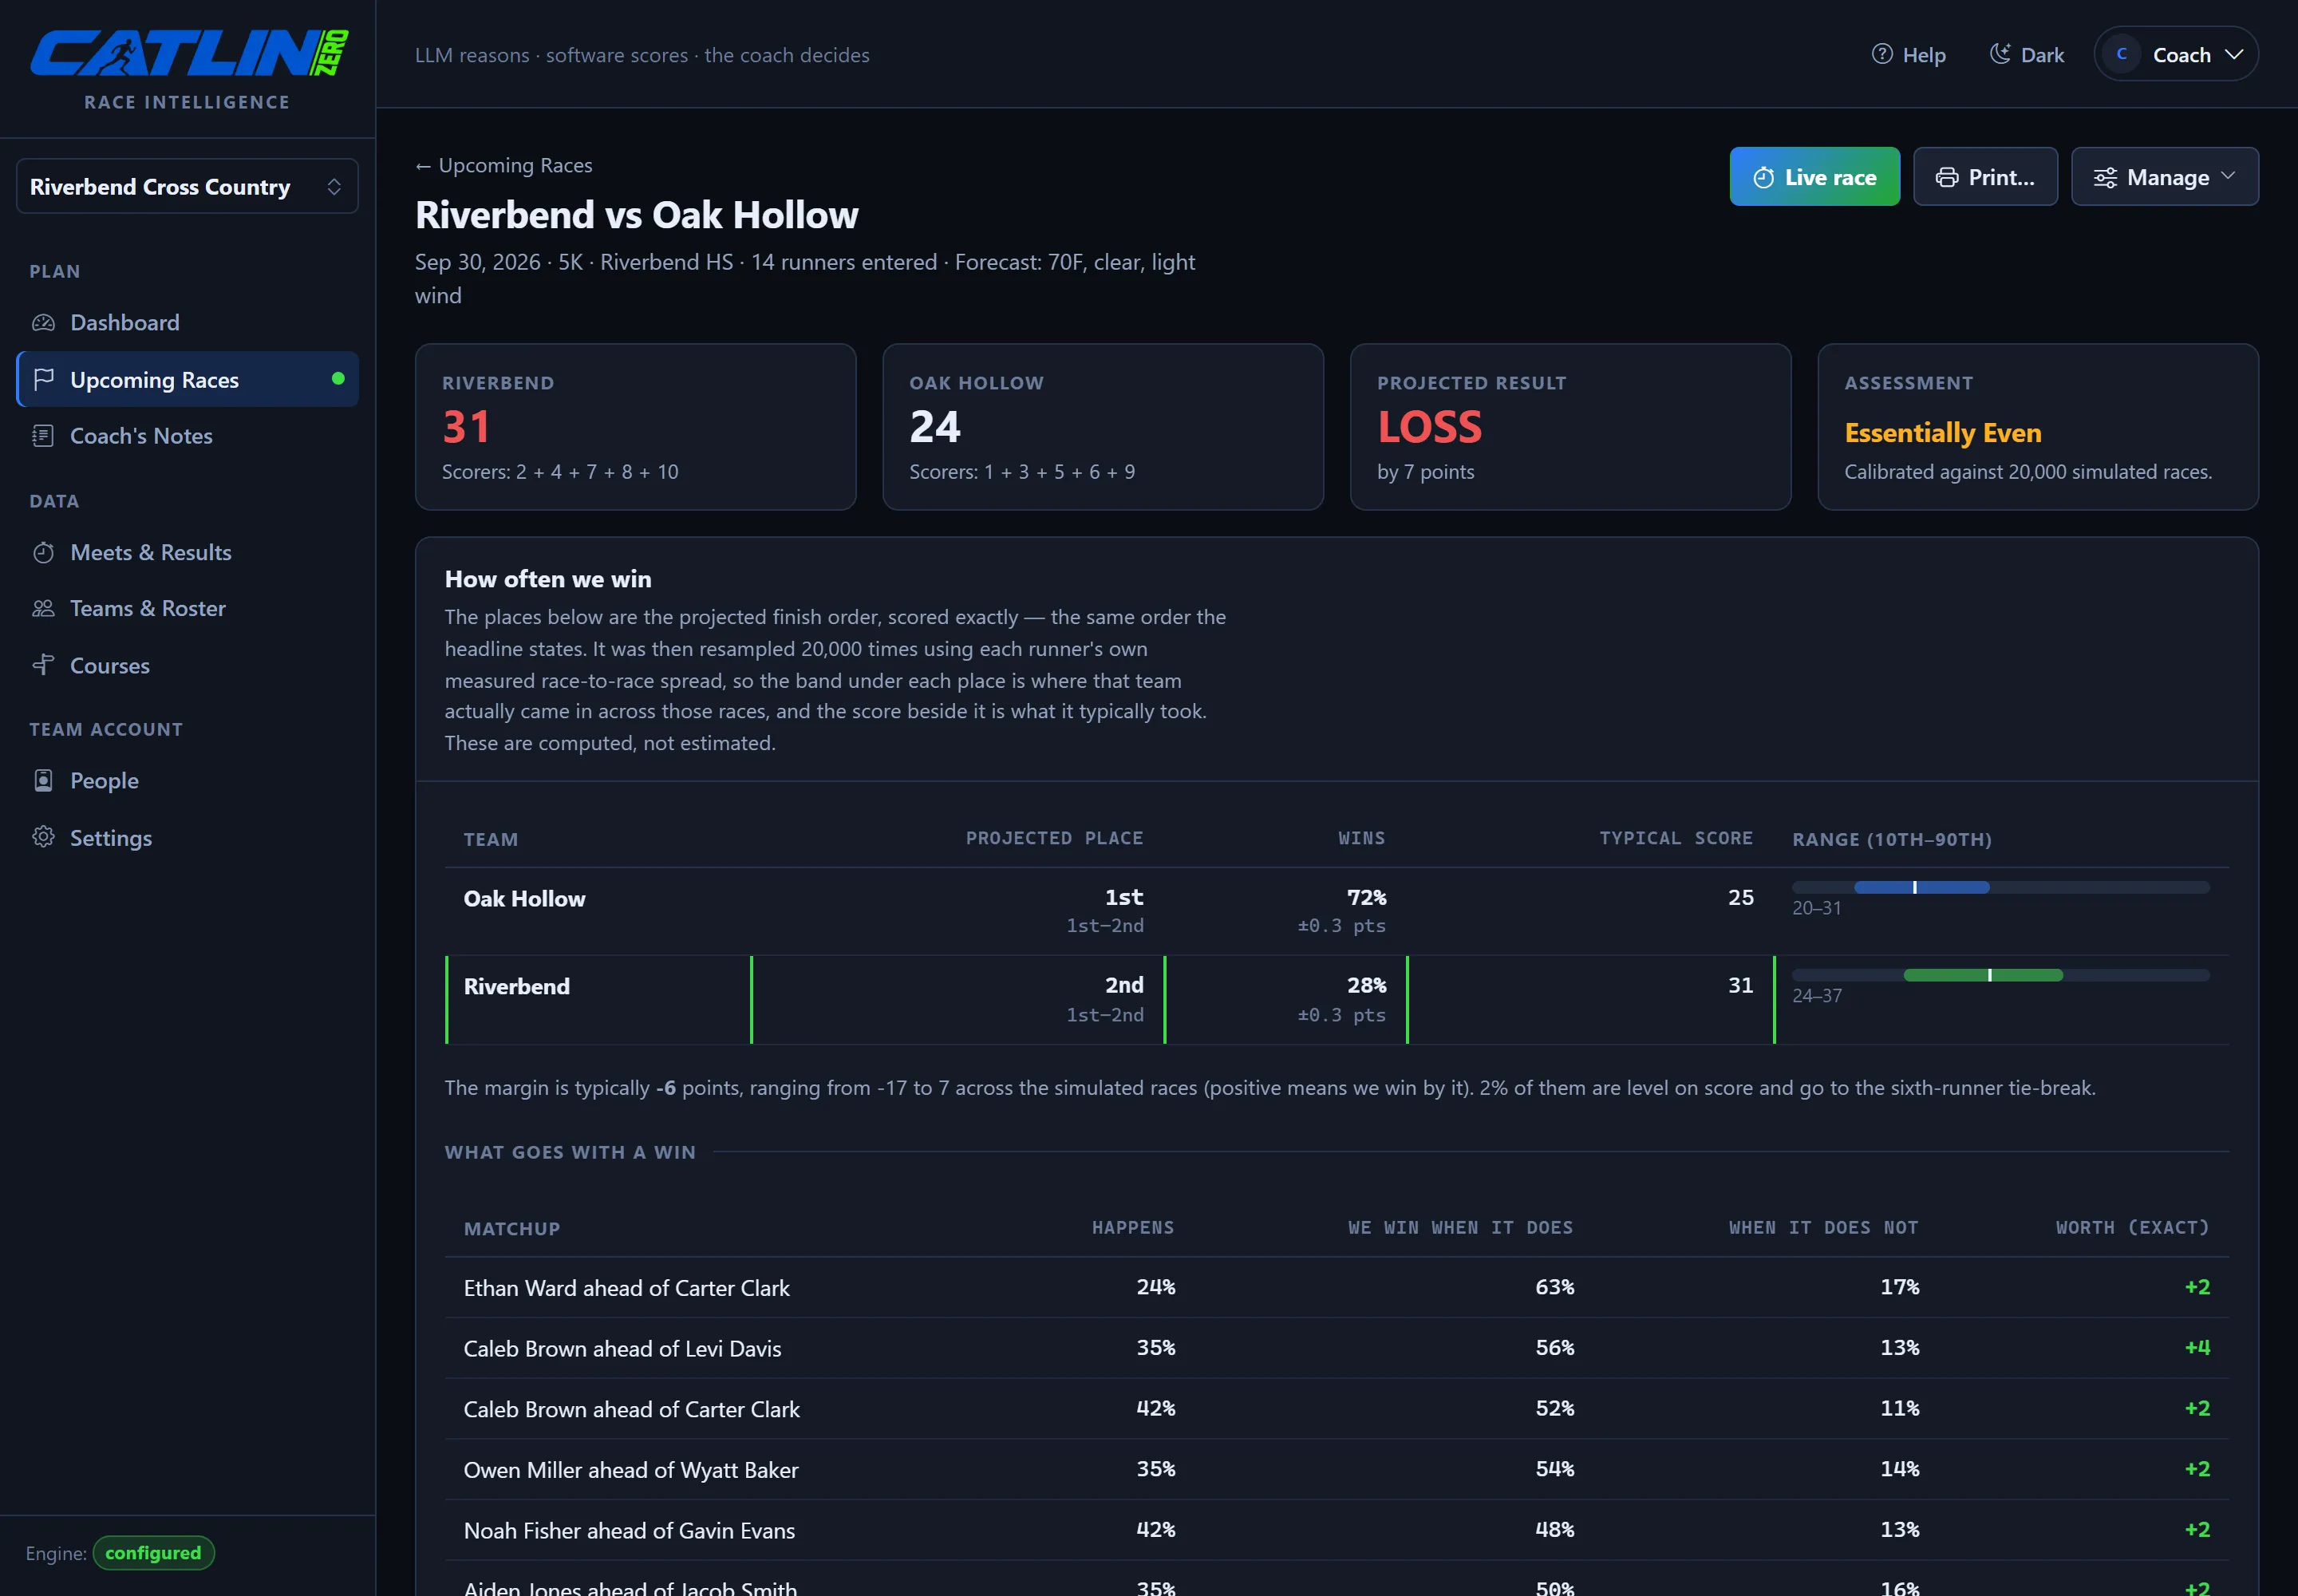
- A projected finish order, with the evidence behind each call.
- Verified team scores, computed exactly.
- The matchups worth the most points, which are almost never between your fastest runners.
- A printable race card per athlete: target, objective, one line of instruction.
At splits & the finish line
Keep the order on a phone
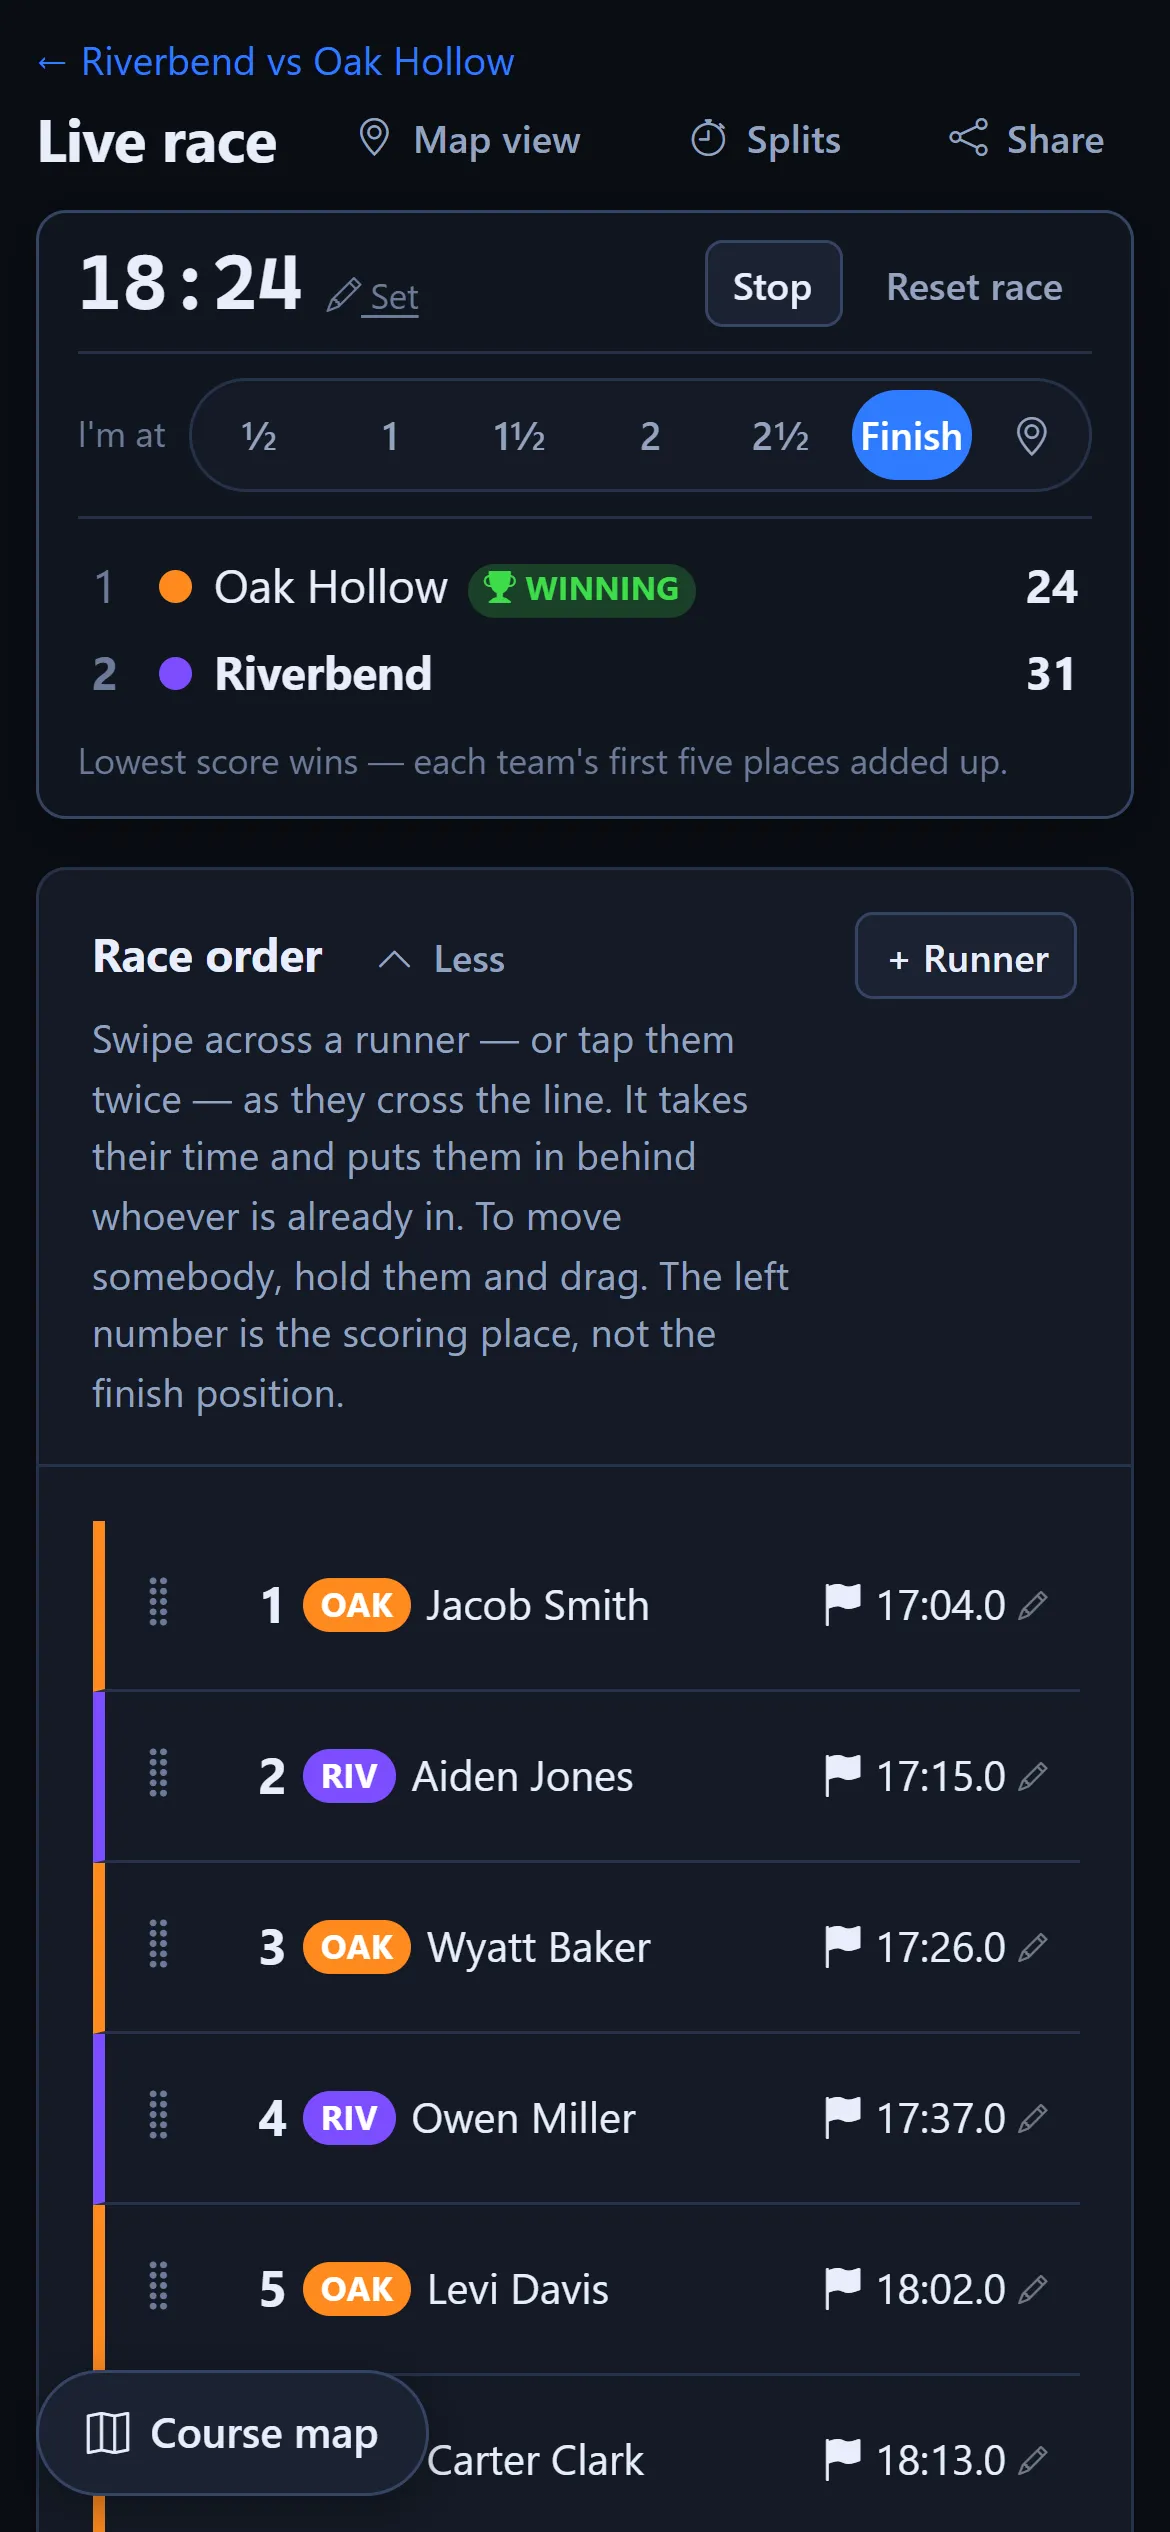
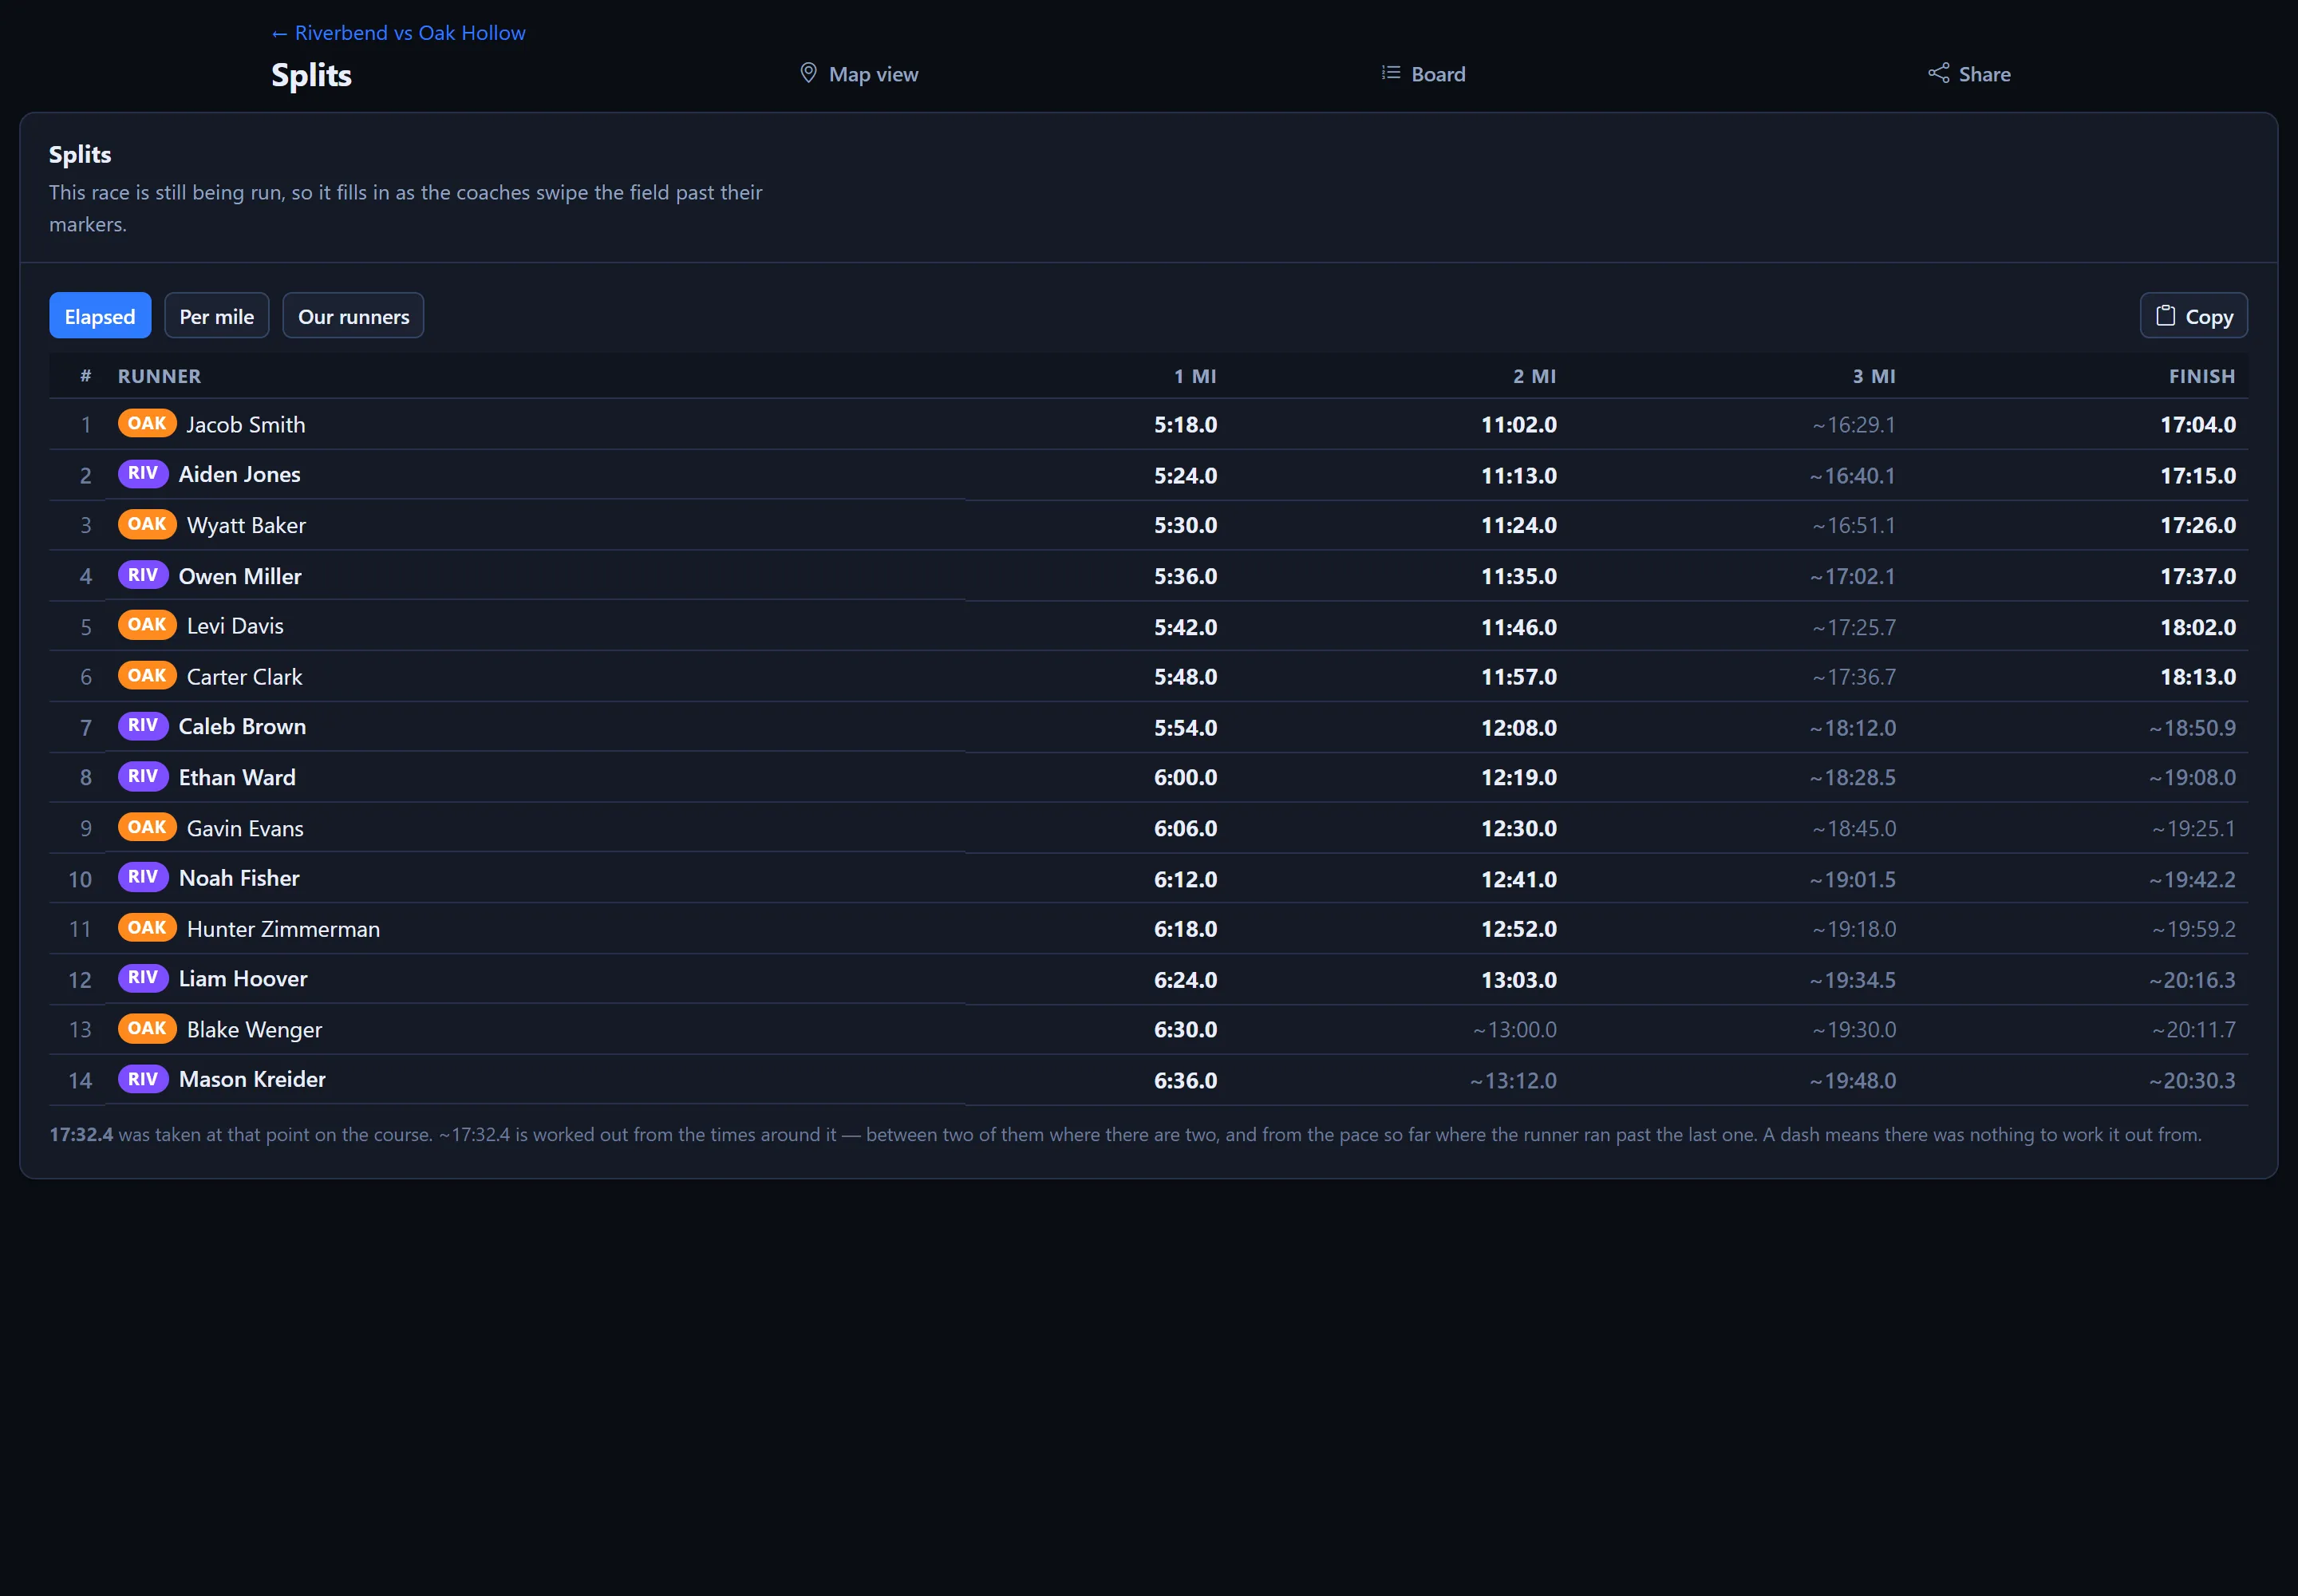
Swipe a runner as they cross the line and the team score follows. Stand at the mile and swipe the field past — that is a split, and it is what fills in everything afterwards. Several coaches can work the same board at once, inputting splits from across the course.
- Starts from the projected order, so most of the work is already done.
- Report from any point on the course, not just the mile markers.
- Correct a finish time when the official results come in.
- Scratch a runner or add a jersey you did not expect.
- Miss a split for a runner? No problem; the predicted value holds.
For everyone watching
Finally everyone can watch the entire race
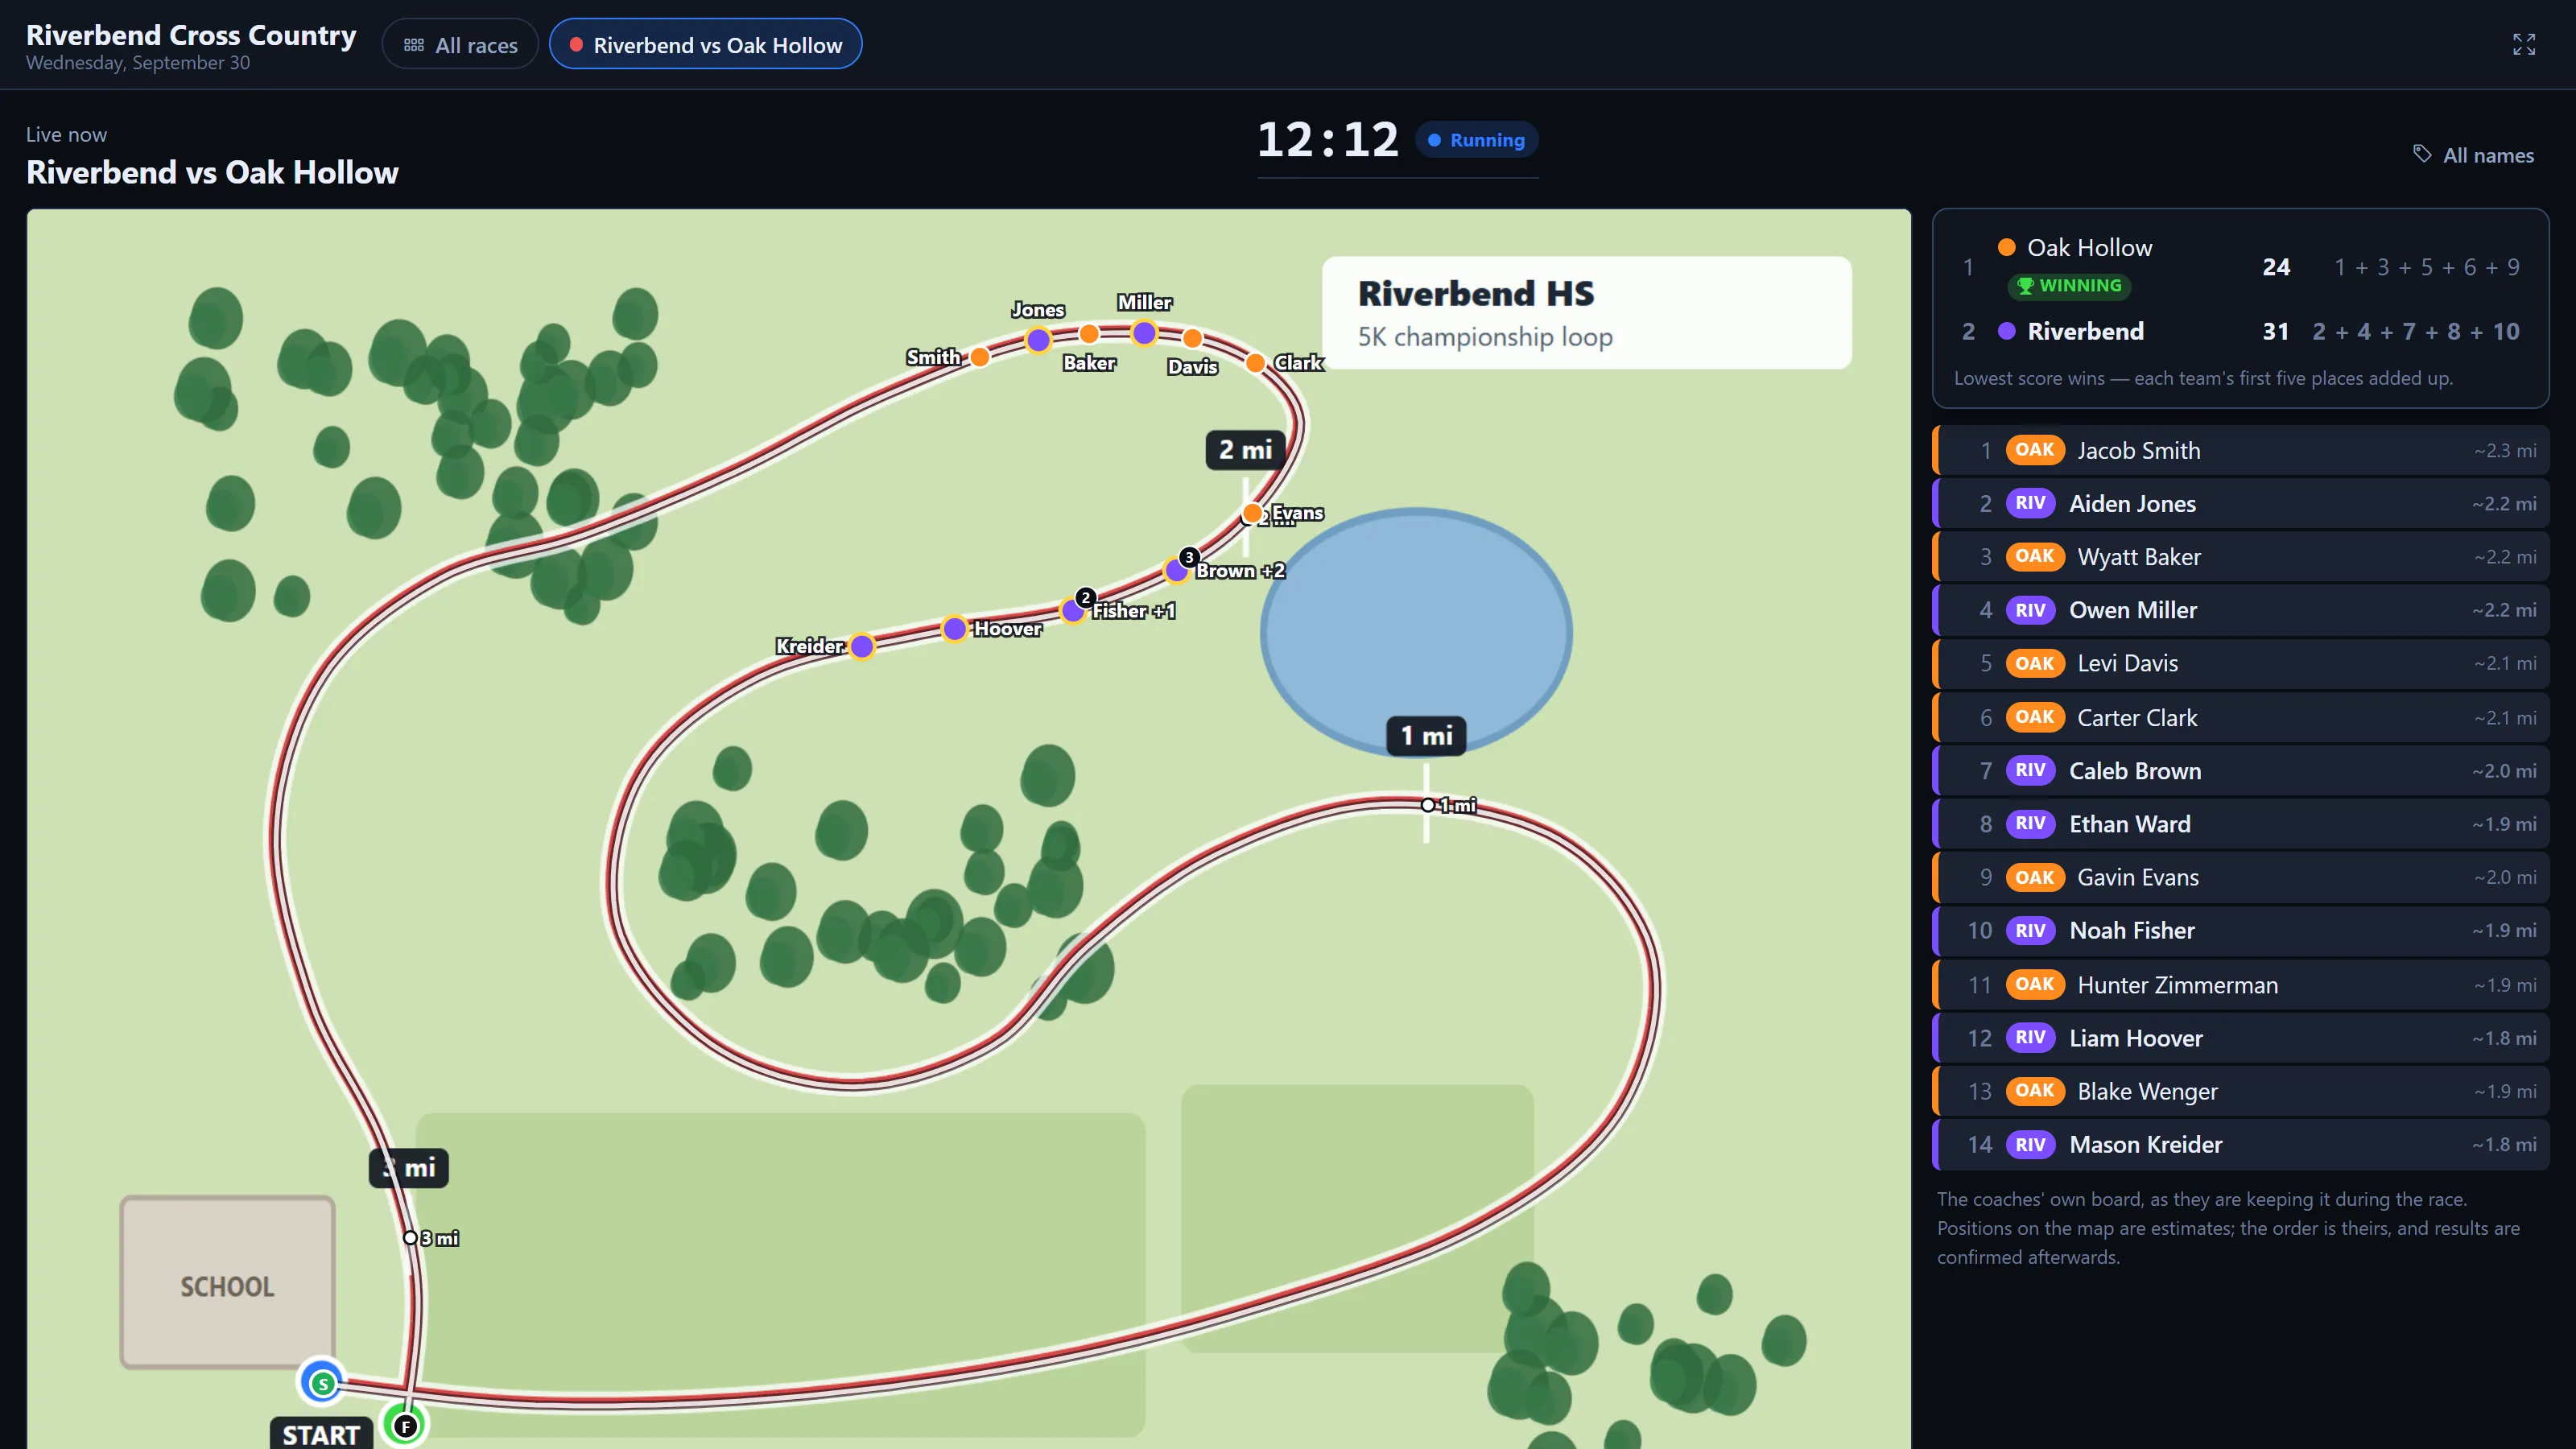
The runners disappear into the woods for fifteen minutes as the parents stand at the finish with no idea what's happening. One link changes that — no app, no account, no sign-in. Send it to the team's families, or put it on a screen in the tent. Everyone stays engaged with the action as runner's positions are predicted and updated in real time.
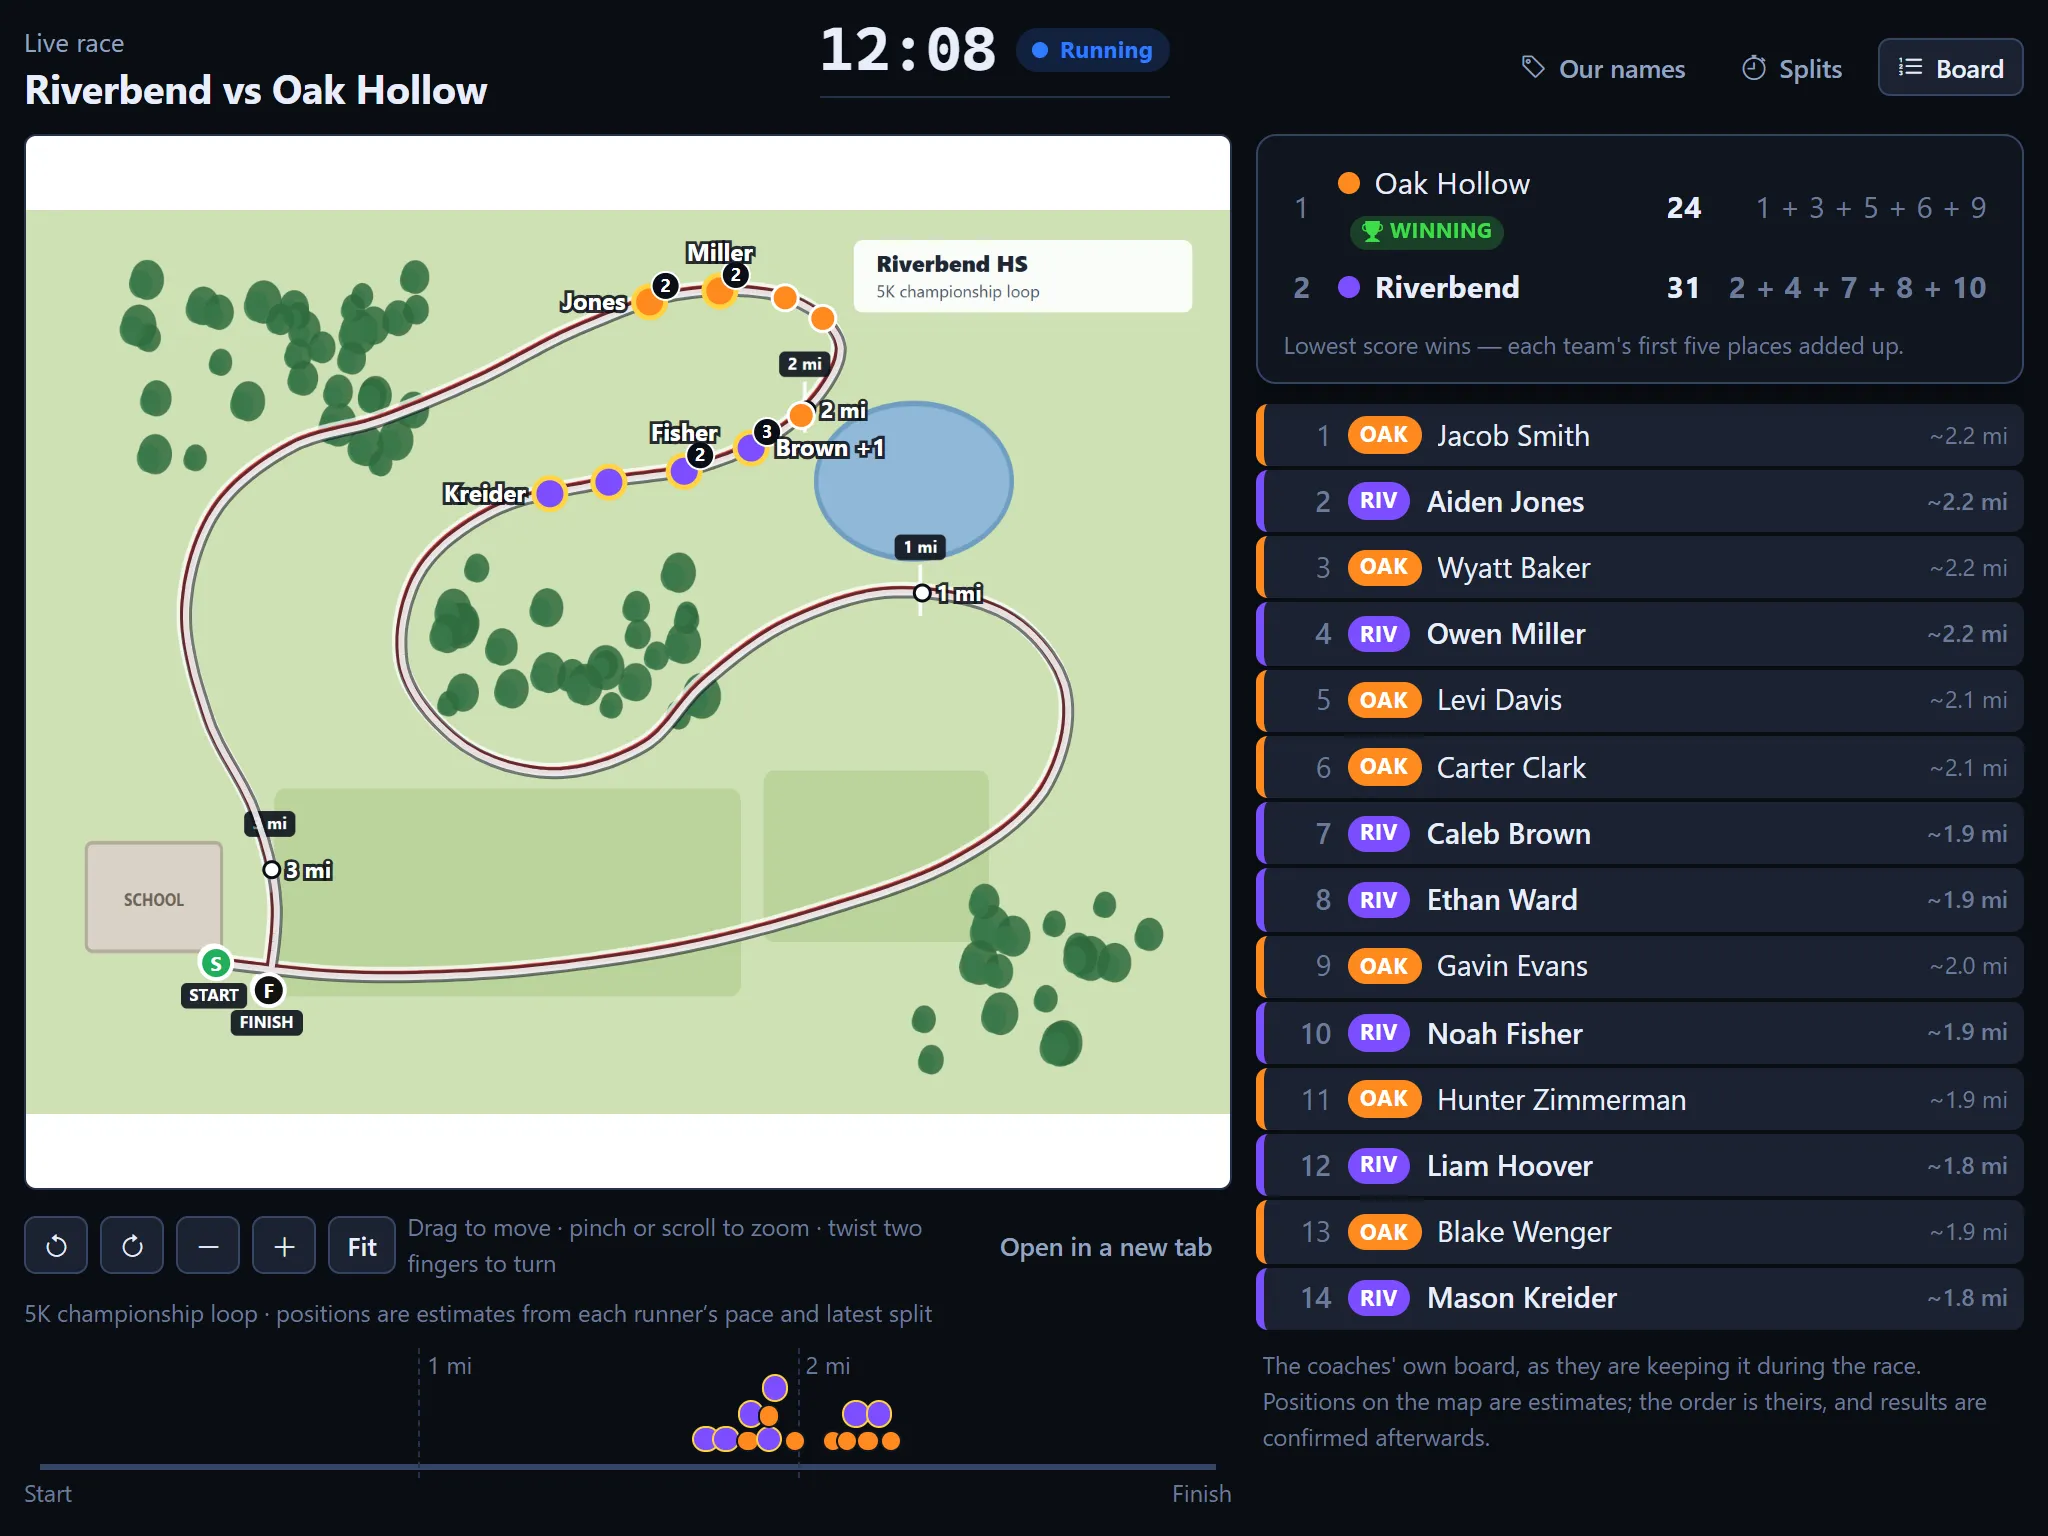
Positions on the map are estimates from each runner's pace and their latest split. The order is the coaches' own, and the page says so.
Built for Coaches and Spectators
The coach
- A plan you can say out loud. Not a wall of numbers — the info on how the meet is actually won.
- Scores you can trust. Computed by the NFHS rules, including displacement and the sixth-runner tie-break.
- Splits without a clipboard. Every swipe on the course becomes a mile split, and the table fills itself in.
- One less thing on meet day. The parents stop asking you how it is going, because they can see.
Spectators
- A link, and nothing else. No app, no account, no sign-in.
- Where your runner is, right now. Plotted on the course map as the race goes on. Everyone is ready when they round the corner.
- The score as it stands. Who is winning, and which places are deciding it.
- One link for the whole season. Send it to parents once or leave it up in the tent; it moves to each race as it starts.
Set and forget
One screen for the whole season
The spectator link is the same for every meet. Put it on a display in the tent in the morning and leave it: it shows the day's races, and jumps to whichever one is running.
After the race
Splits you never had to write down
Every swipe on the course was a split. The table shows what was taken and what was worked out from it, drawn differently, because the difference matters more than the times do. Copy the whole thing into a sheet or a results post.
Early access
Get it for your season
It is being used by real teams at real meets, and invitations go out in batches so that each one gets set up properly. Tell me a little about your team and I will be in touch — it is me replying, not a robot.
Thanks — you're on the list.
I'll email you from my own address when there's a place for your team. If your season is already under way, say so in a reply and I'll move you up.